
Back in February TAG started a long term project to measure exactly how much erosion was being caused by mountain biking on the military lands.
With over 400 miles of tracks and trails we can’t do it all. But we did choose two trails on Beacon Hill for a closer look.
Surveying this kind of terrain is done using a Leica GS07 NetRover (expensive…accurate…) and a DJI drone. The Leica precisely measures a series of points on the terrain and the drone shoots several hundred images. A technique called photogrammetry then merges the two to produce an accurate 3D representation of the surface.
The drone flew back in January to shoot the first set of images. It might be cold but waiting for vegetation to die back helps. Photogrammetry can struggle with the green stuff plus the bracken hides the trail surface and thats the bit we are really interested in.
The drone flew for a second time this week and the images processed.
We were genuinely surprised at what the results told us.
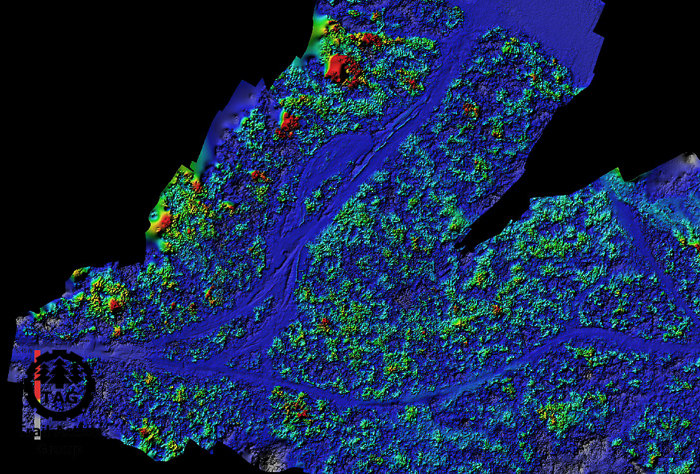
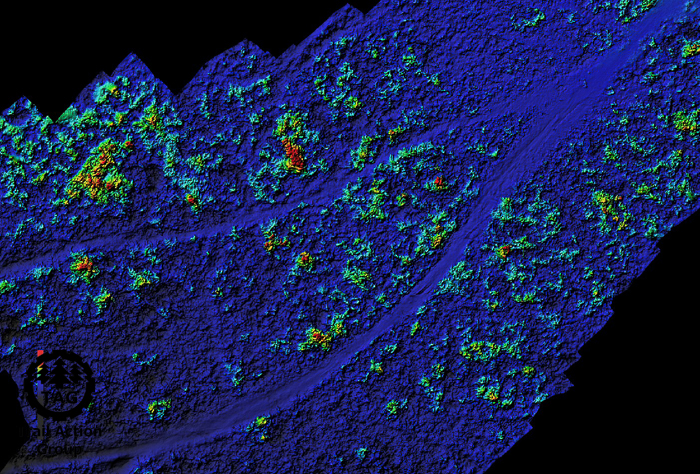
Below are two screenshots of direct comparison between January and December. The red and green bits show the areas of greatest change and the solid blue shows area of little or no change. In this view all the trails show up as solid blue.
Or in other words, nearly 12 months of MTB and at times some heavy rain has triggered – visually at least – no changes
So the next step was to bring both sets of survey results into a piece of GIS software (Called Global Mapper) and run some more analysis.
The area of the trails themselves are the important bits. The amount of bracken growth and dieback over a year might be interesting to someone (Wildlife Trusts – please get in touch!) but for MTB the trail is the focus. A series of areas were drawn to define the trails then the measure tools told to ignore everything outside the boundary.
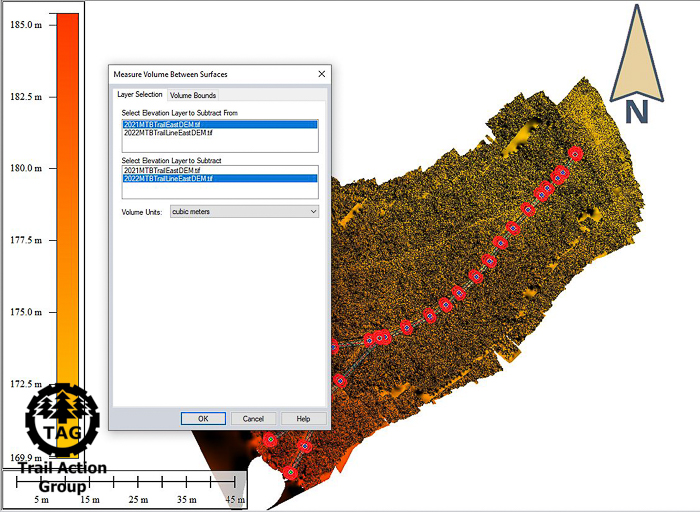
The result; No measurable difference between the trails. Nothing significant enough for us to record…so the conclusion is neither of the trails is causing any further erosion. Both have been established and in regular use for decades so we can conclude the trails are stable and not deteriorating.
We can do some more analysis, such as checking out the slope and distance:
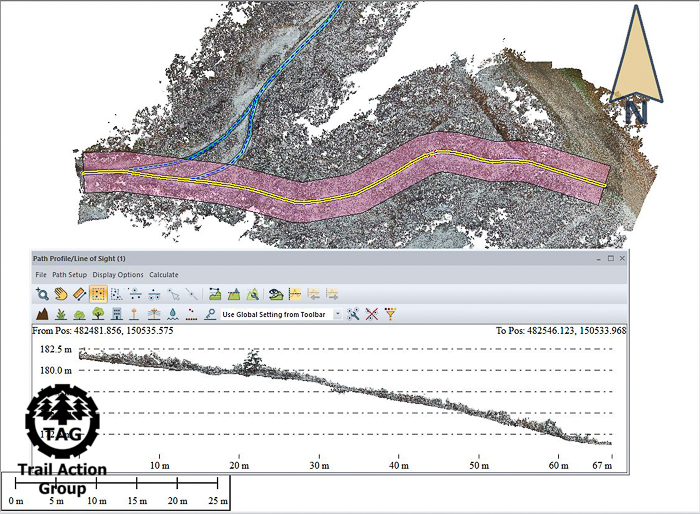
Which might be a very high tech way of planning a ride.
But the more important analysis is looking at the watershed. How does water flow off the land and has the trail impacted it?
There is a lot going on in the next image:
- The underlying green is derived from open government lidar data known as a digital elevation model
- The contours are created from the digital elevation model
- The red lines are where the trails run
- The white rectangles are highly detailed top-down views of the trails created from the drone images
- The blue lines represent channels and routes water will naturally take
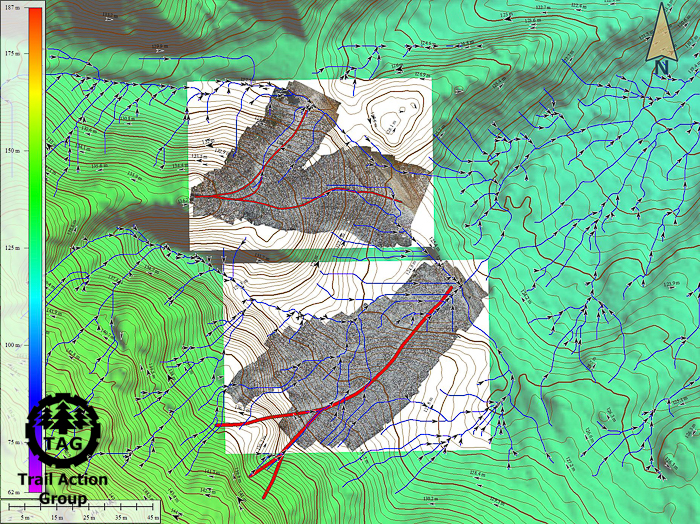
By good fortune both trails avoid interfering too much with natural water courses. This helps the trail and helps the terrain cope with rainfall.
Why should we be bothered about rain and erosion? Well this image takes a wider view:
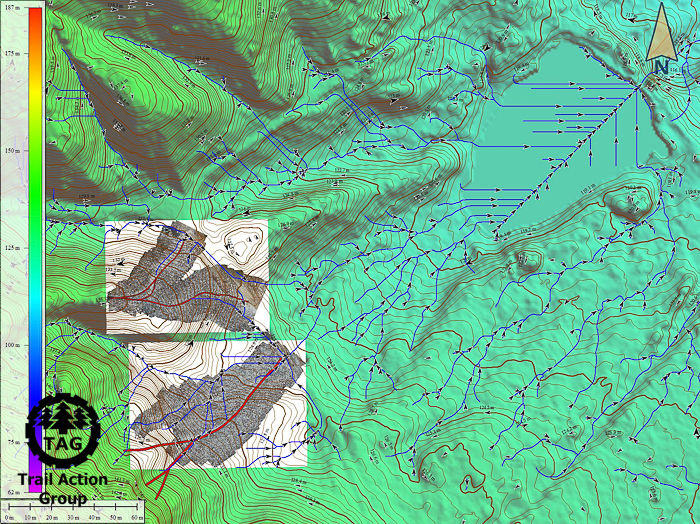
The trails are close to water courses that drain into one of the reservoirs at Beacon Hill. Thats the flat bit by the N arrow.
If we were seeing significant erosion then the silt could potentially be ending up in the reservoir. That would be causing unwelcome changes, both for water management and wildlife.
Using this kind of analysis we can spot potential harm or issues before they occur and take steps to prevent or mitigate any impact mountain biking (or indeed any activity) may be having on the terrain.
Summary
We are very confident any mountain biking erosion on these two trails is exceptionally low. There just isn’t enough change for us to measure over the year and this was surprising.
What we don’t know is how many riders are using these trails. Anecdotally we know they are popular and trails that do drop out of use quickly start to disappear. There is an example of this in the survey. But both trails of interest remain clear and active and knowing how many folks ride em would be useful.
The second thing to acknowledge is the distance these trails cover is a mere 264.07m or 0.164 miles. Compared to the 400+ miles of trails we have identified across the entire estate this distance isn’t even a rounding error.
And there will be areas that are eroding and where the impact of MTB could be measured over time. Knowing if there is potential harm or risk of creating – quite literally – downstream problems would be the first step in thinking about what to do; close the trail, move it, modify or change. We can start to look for potential harm before it happens and take steps to mitigate before the blame game message of how awful those mountain bikers are before it happens.
What this kind of evidence must do is demonstrate mountain biking might not be the one-up-from-dog-shit lowlife some would see us labeled as. There are two reasons for this. Firstly, the evidence of change cannot be measured and its insignificant thus the harm of the activity is minimal. Secondly by measuring this we demonstrate how much we care about the lands.
Setting minimal harm against massive physical and mental benefits of being there is – to put it bluntly – a no-brainer positive outcome.
Consider this; DIO have their own surveyors. They will be working with tools, software and methods that are the same or better than what we can achieve by ourselves. We would be happy to share data with them if it made the world a better place and enabled level headed evidence-driven policy.
What could we deliver together if collaboration and cooperation was the modus operandi?

Pingback: Deleted Evidence? Gather Your Own… | Trail Action Group